 EMODnet Product Catalogue
Baltic Sea
Type of resources
Available actions
Topics
Keywords
Contact for the resource
Provided by
Years
Formats
Representation types
status
Scale 1:
Resolution
-
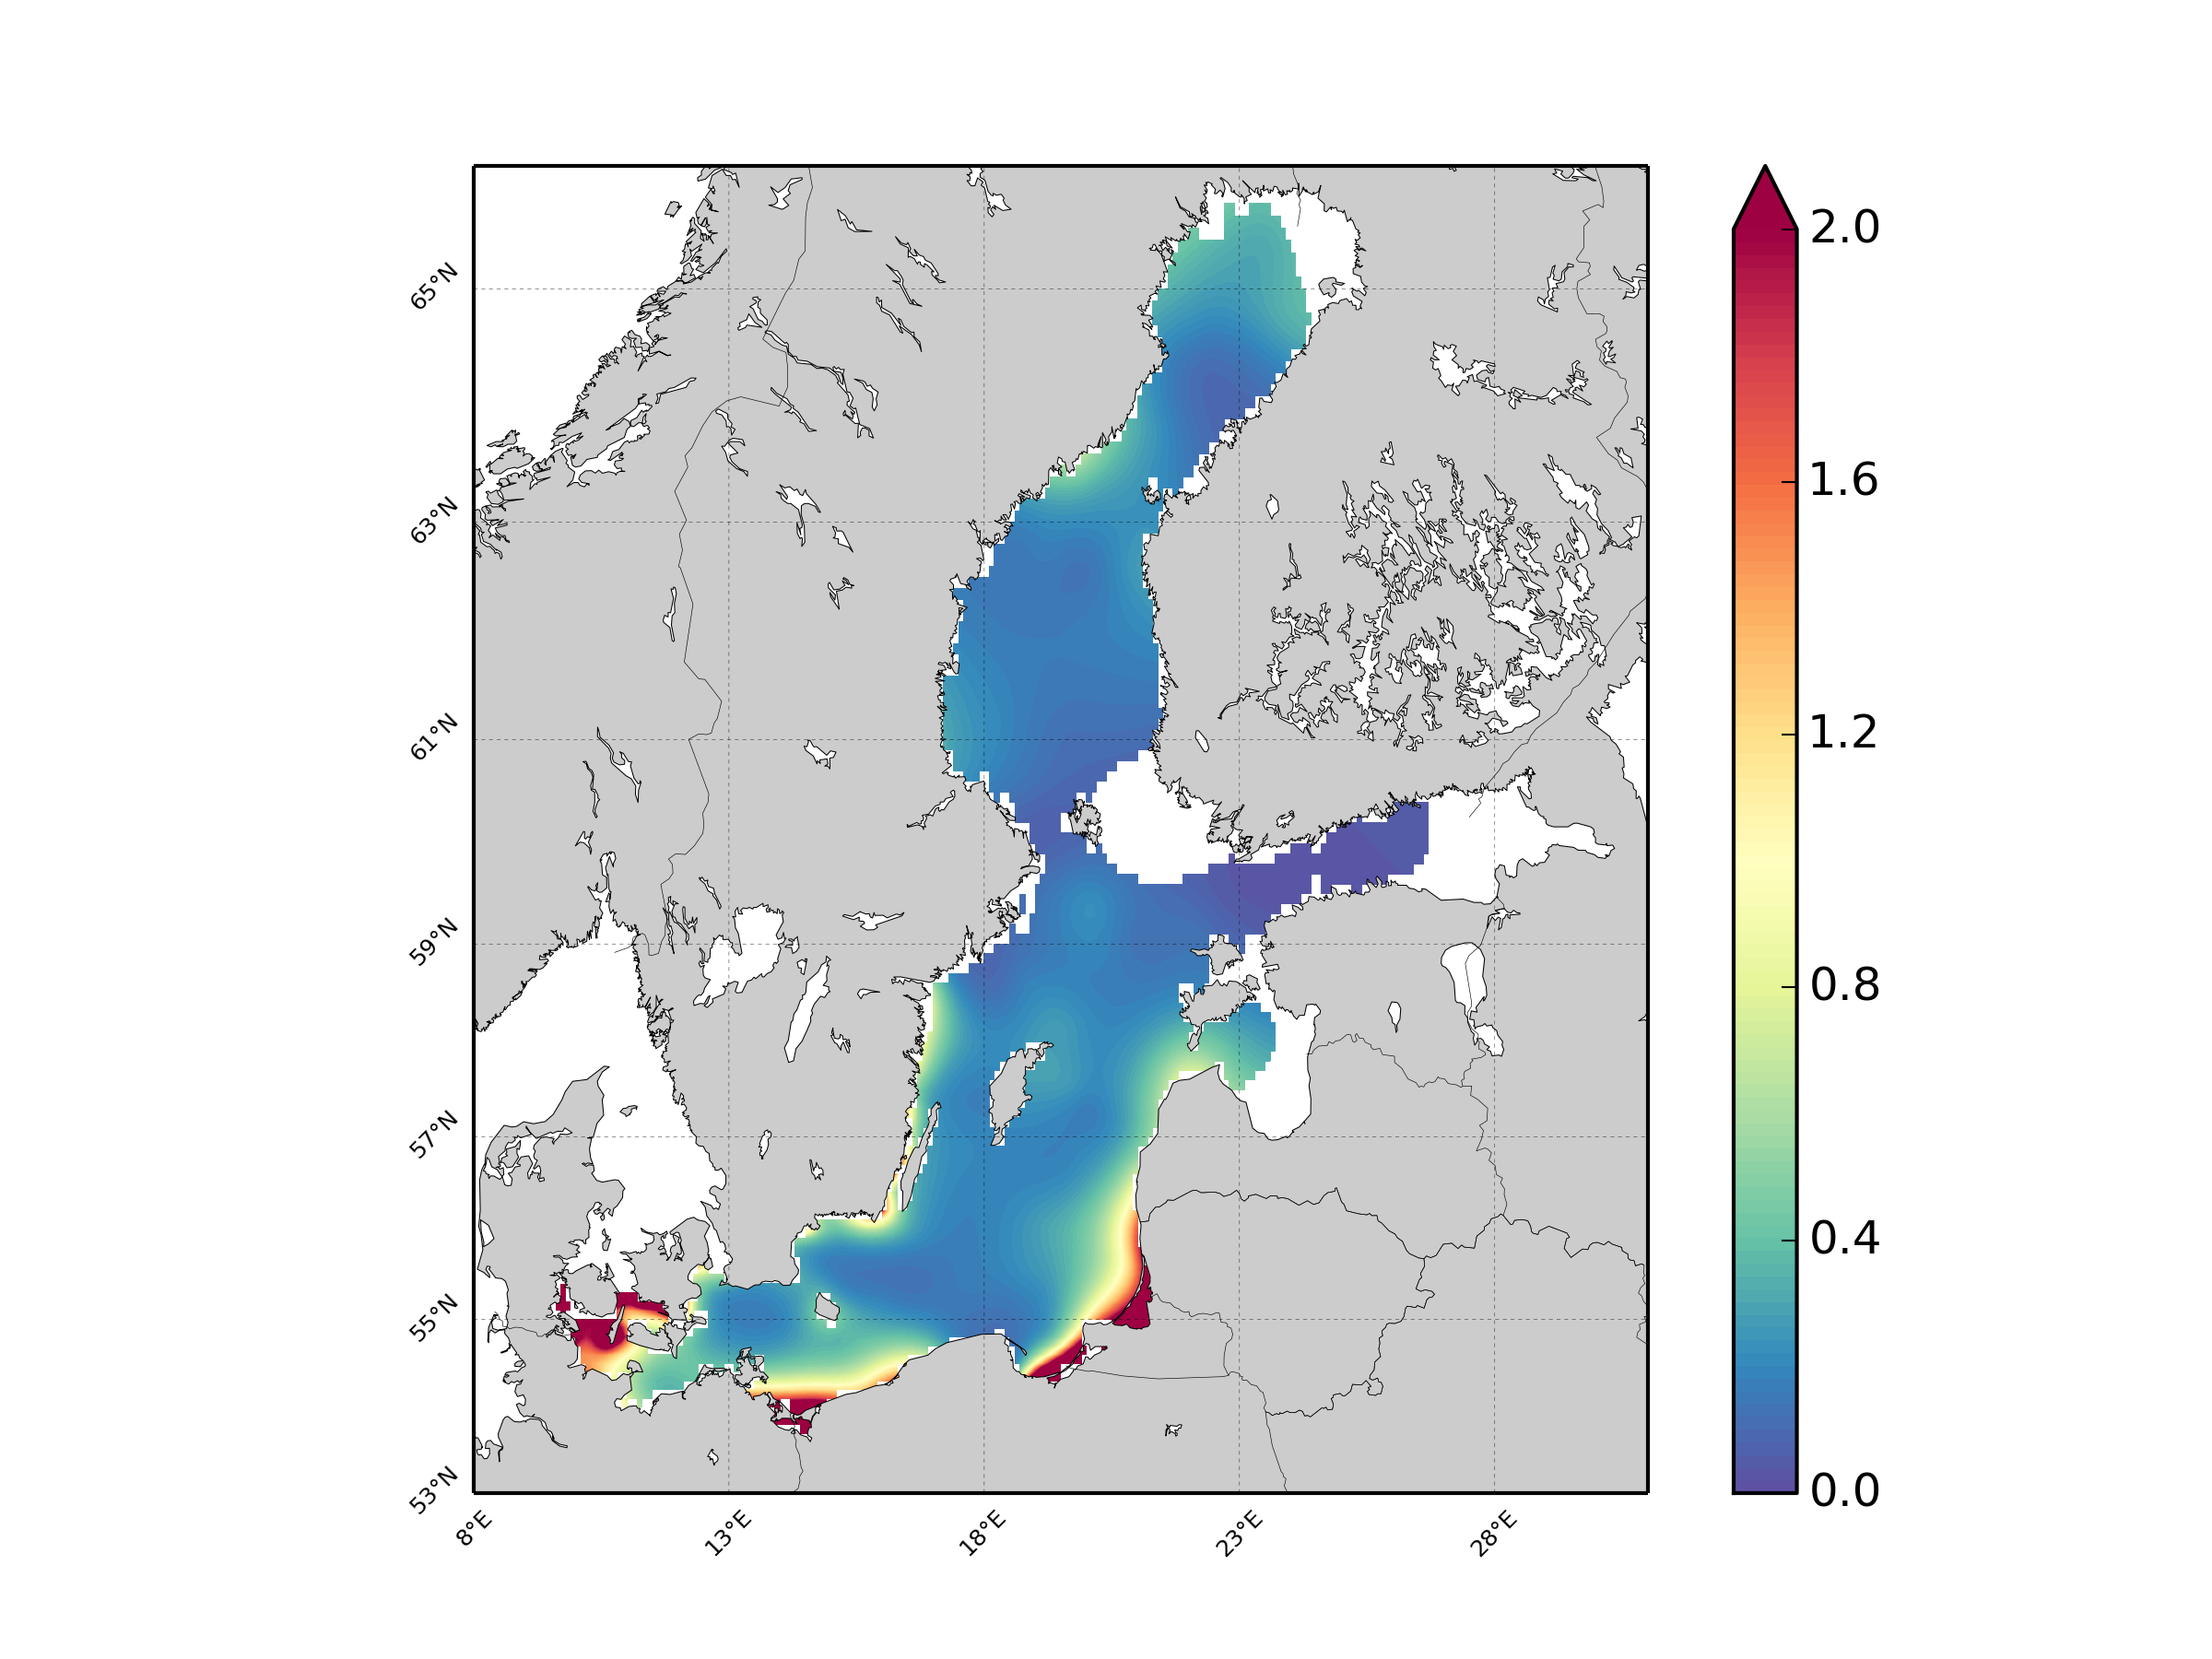
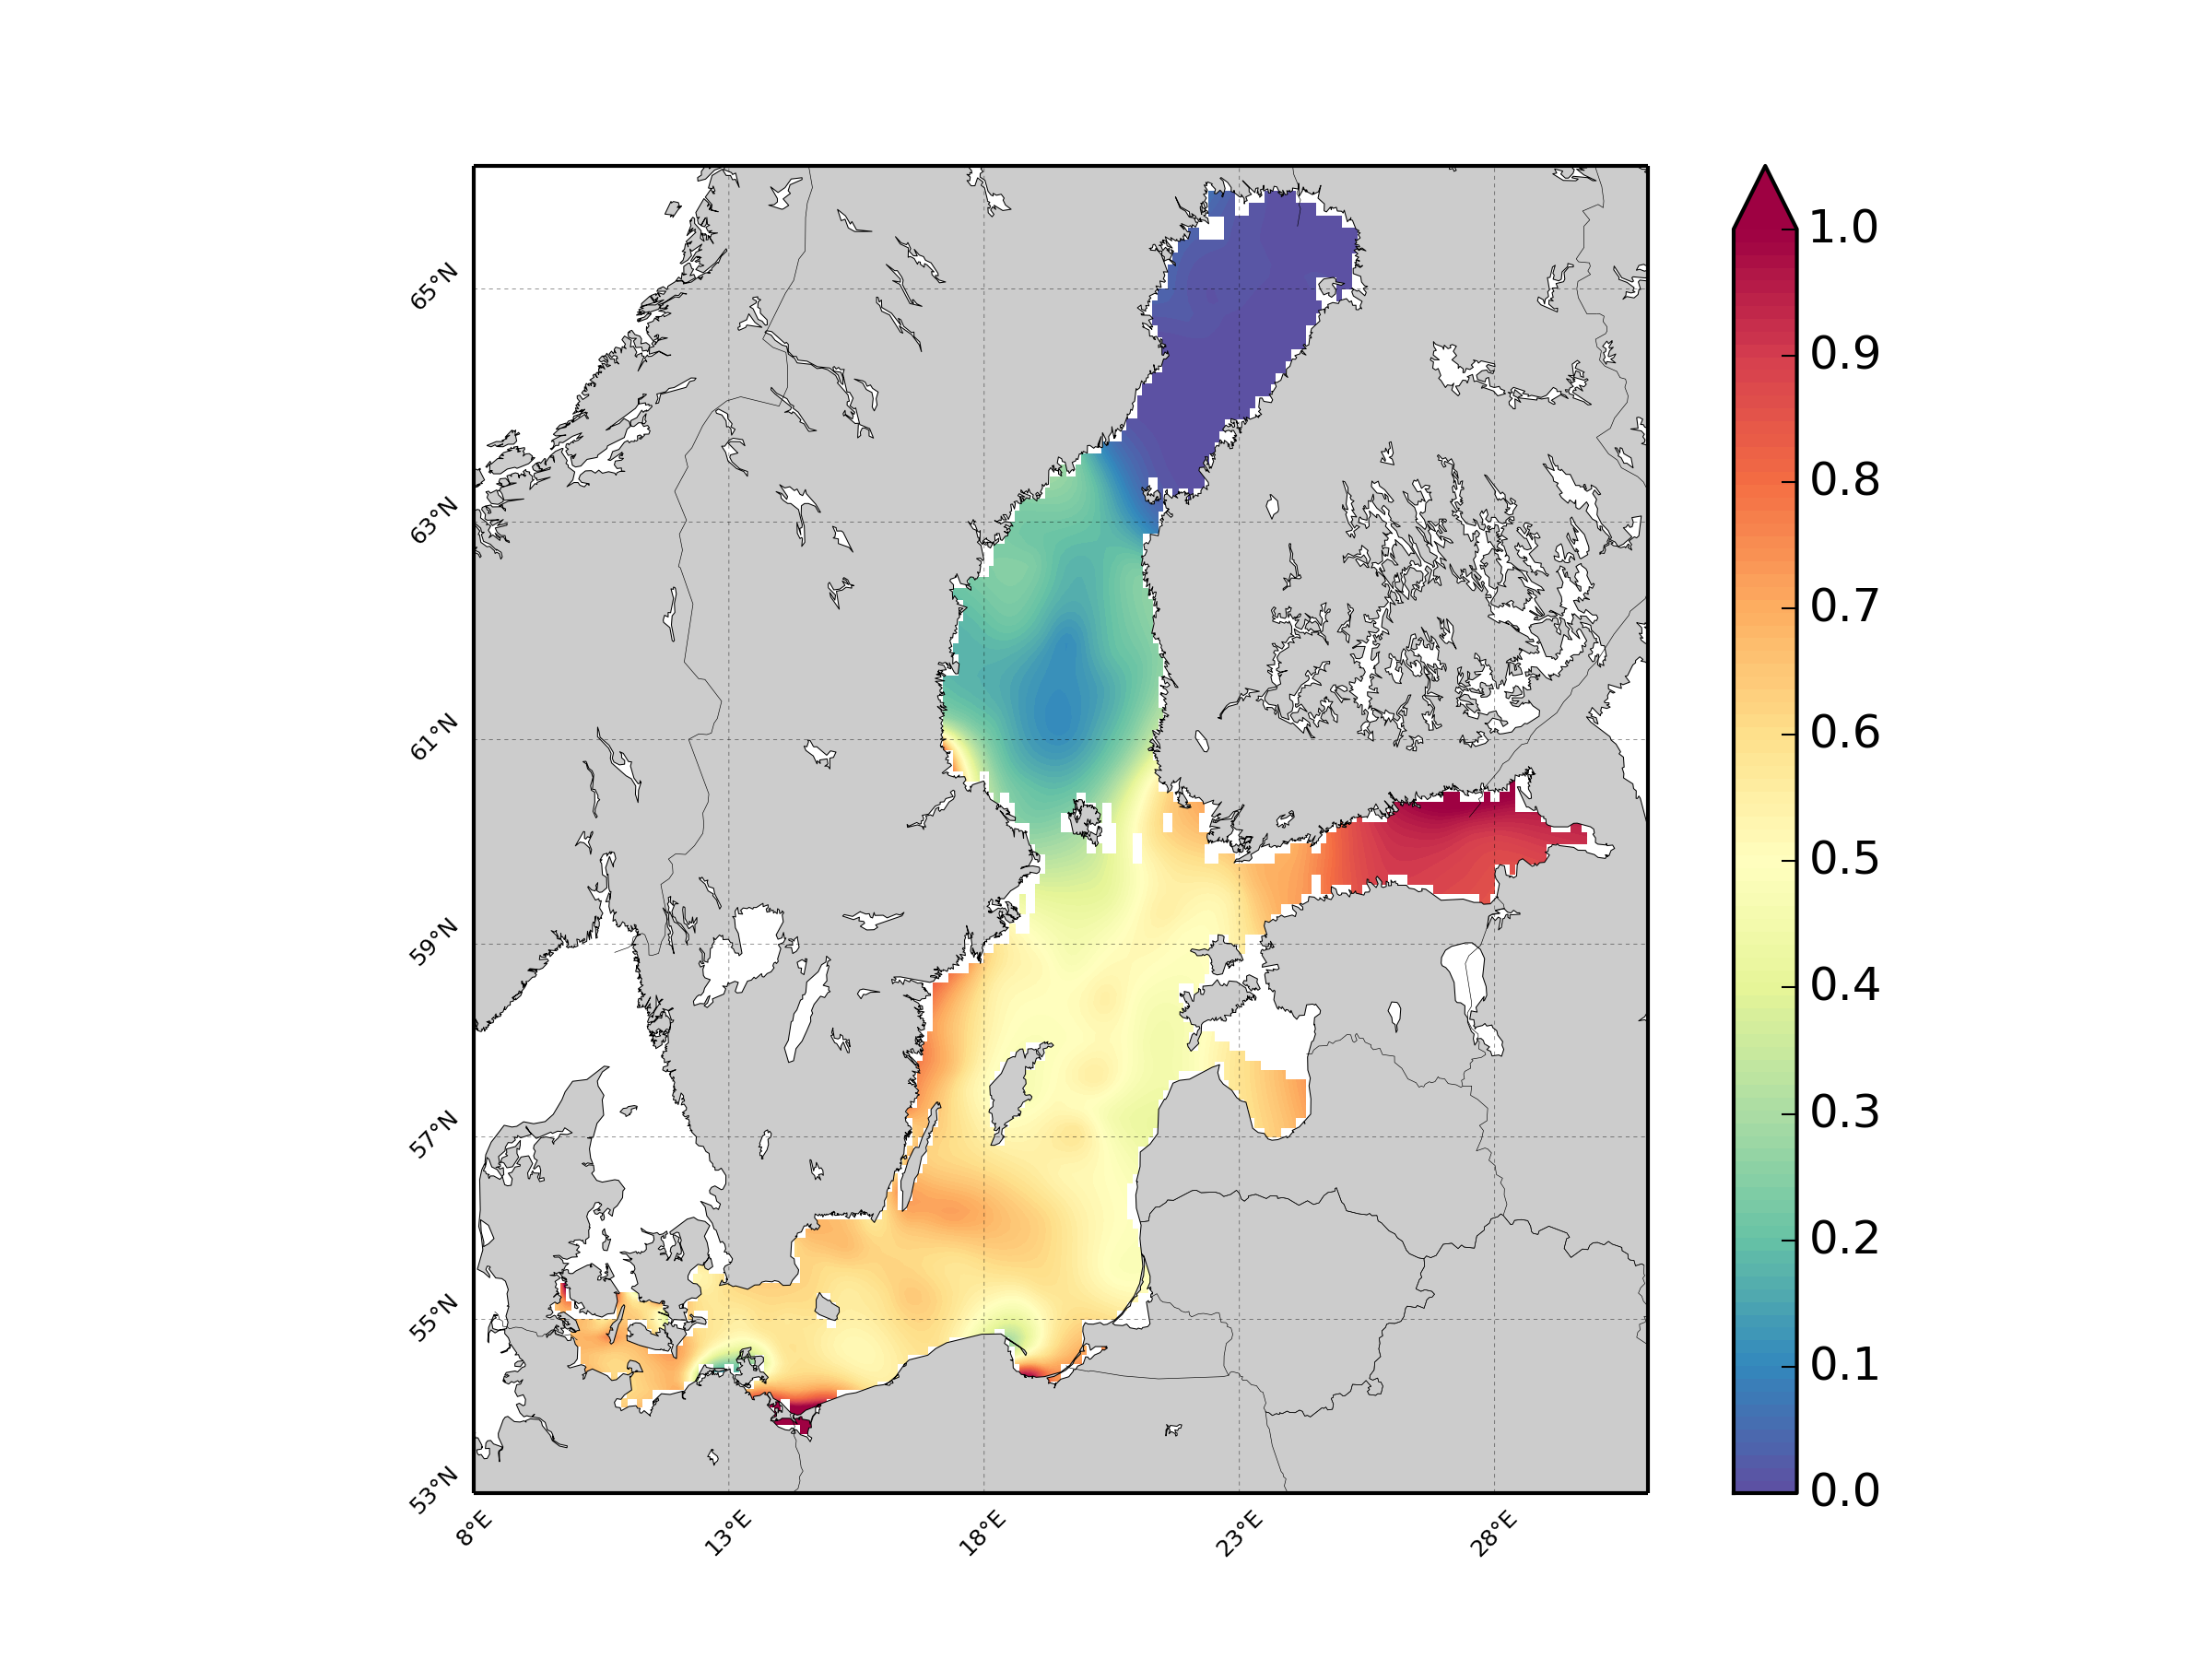
Units: umol/l. Method: spatial interpolation produced with DIVA (Data-Interpolating Variational Analysis). URL: http://modb.oce.ulg.ac.be/DIVA. Comment: Every year of the time dimension corresponds to a 10-year centred average for each season : - winter season (December-February), - spring (March-May), - summer (June-August), - autumn (September-November). Diva settings: Snr=1.0, CL=0.7
-
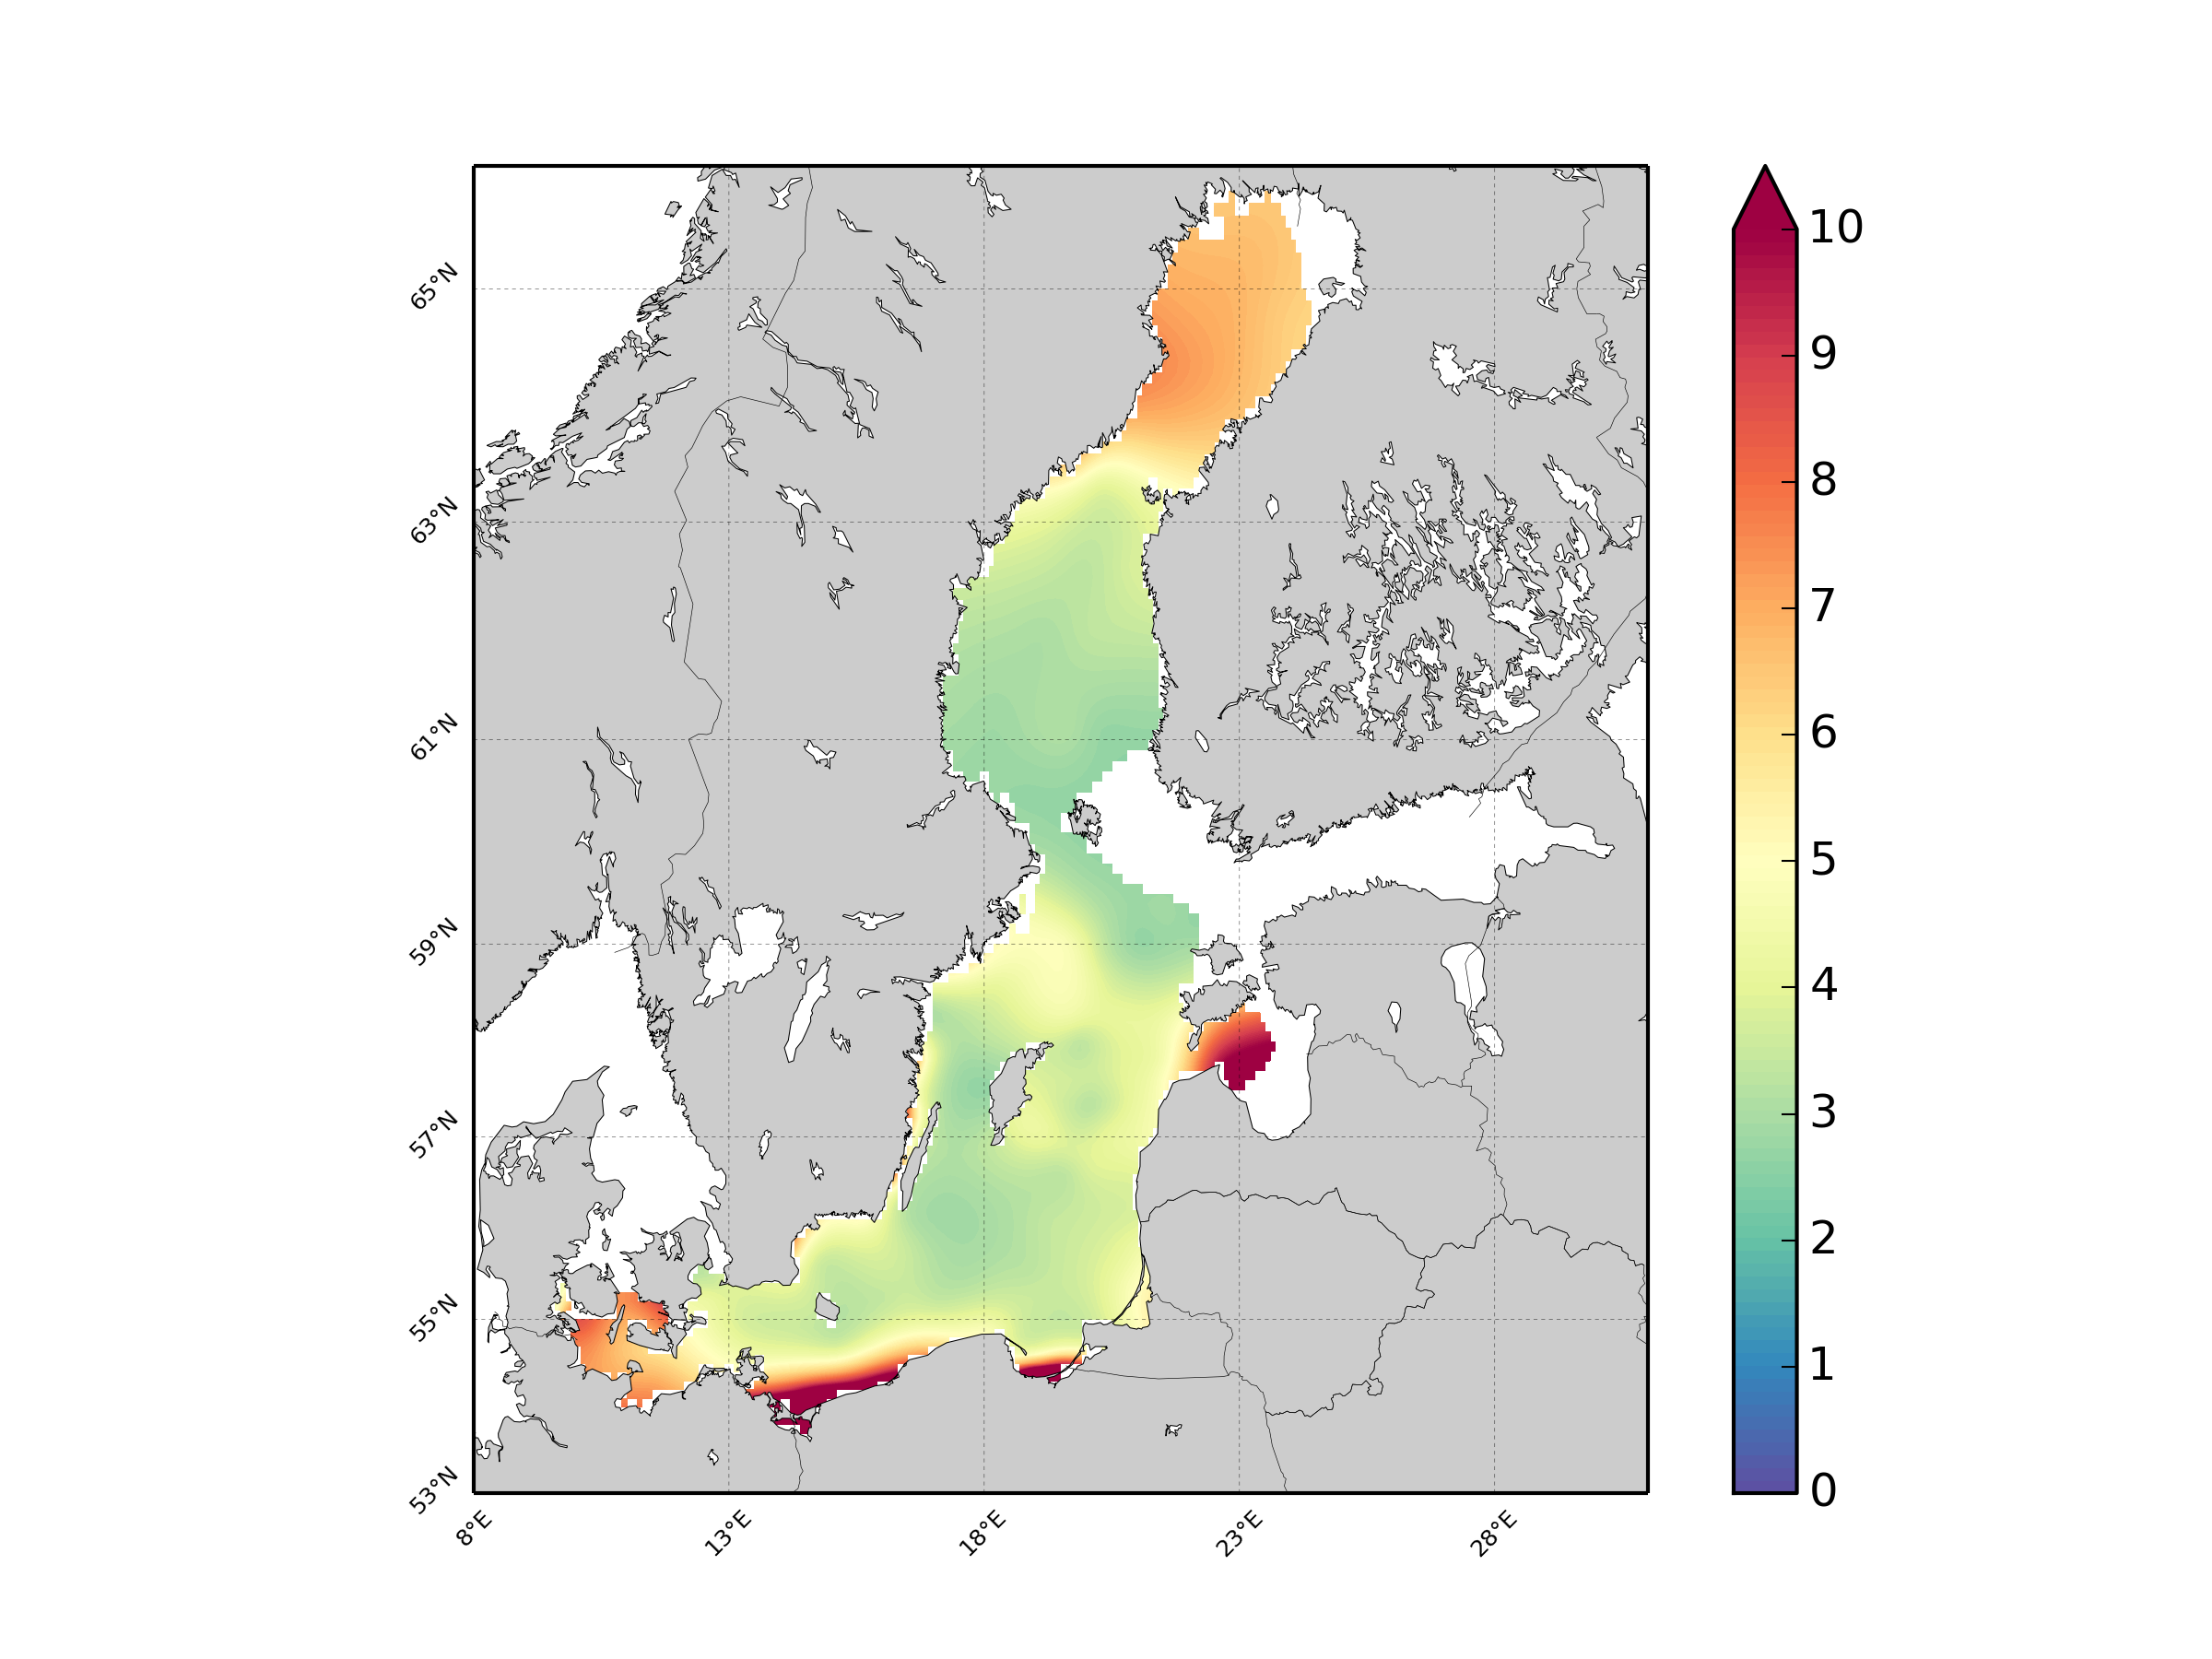
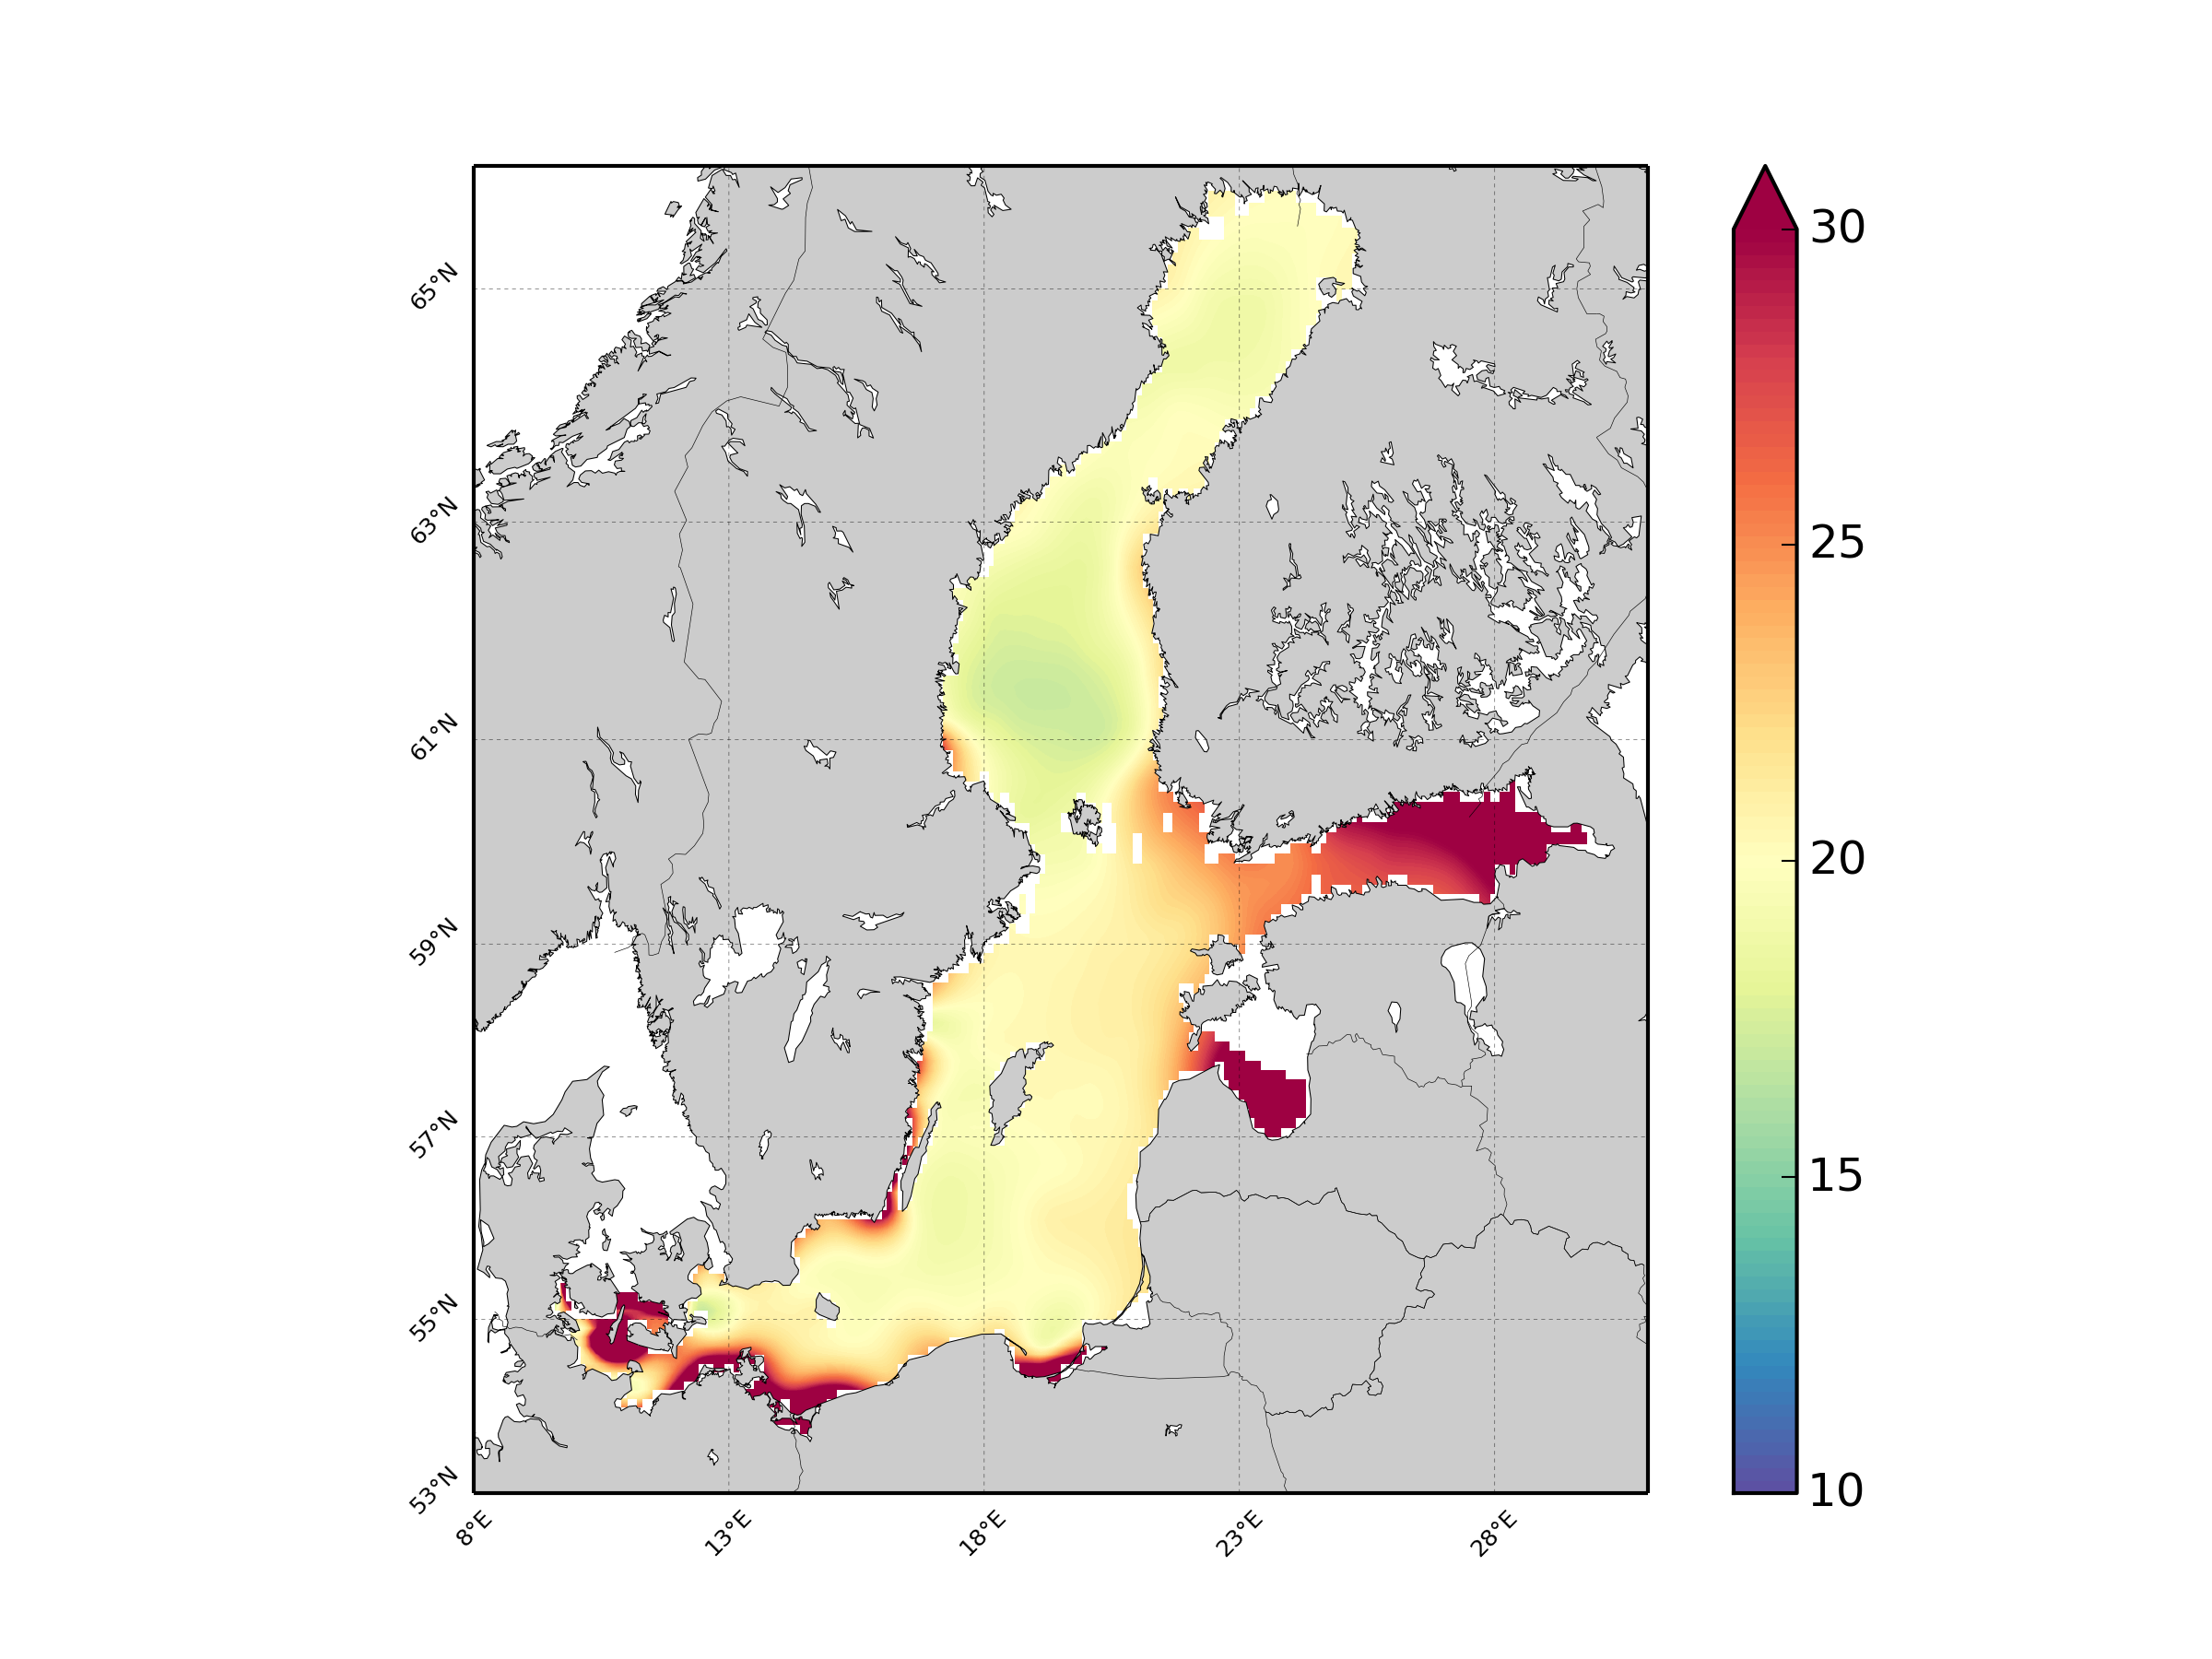
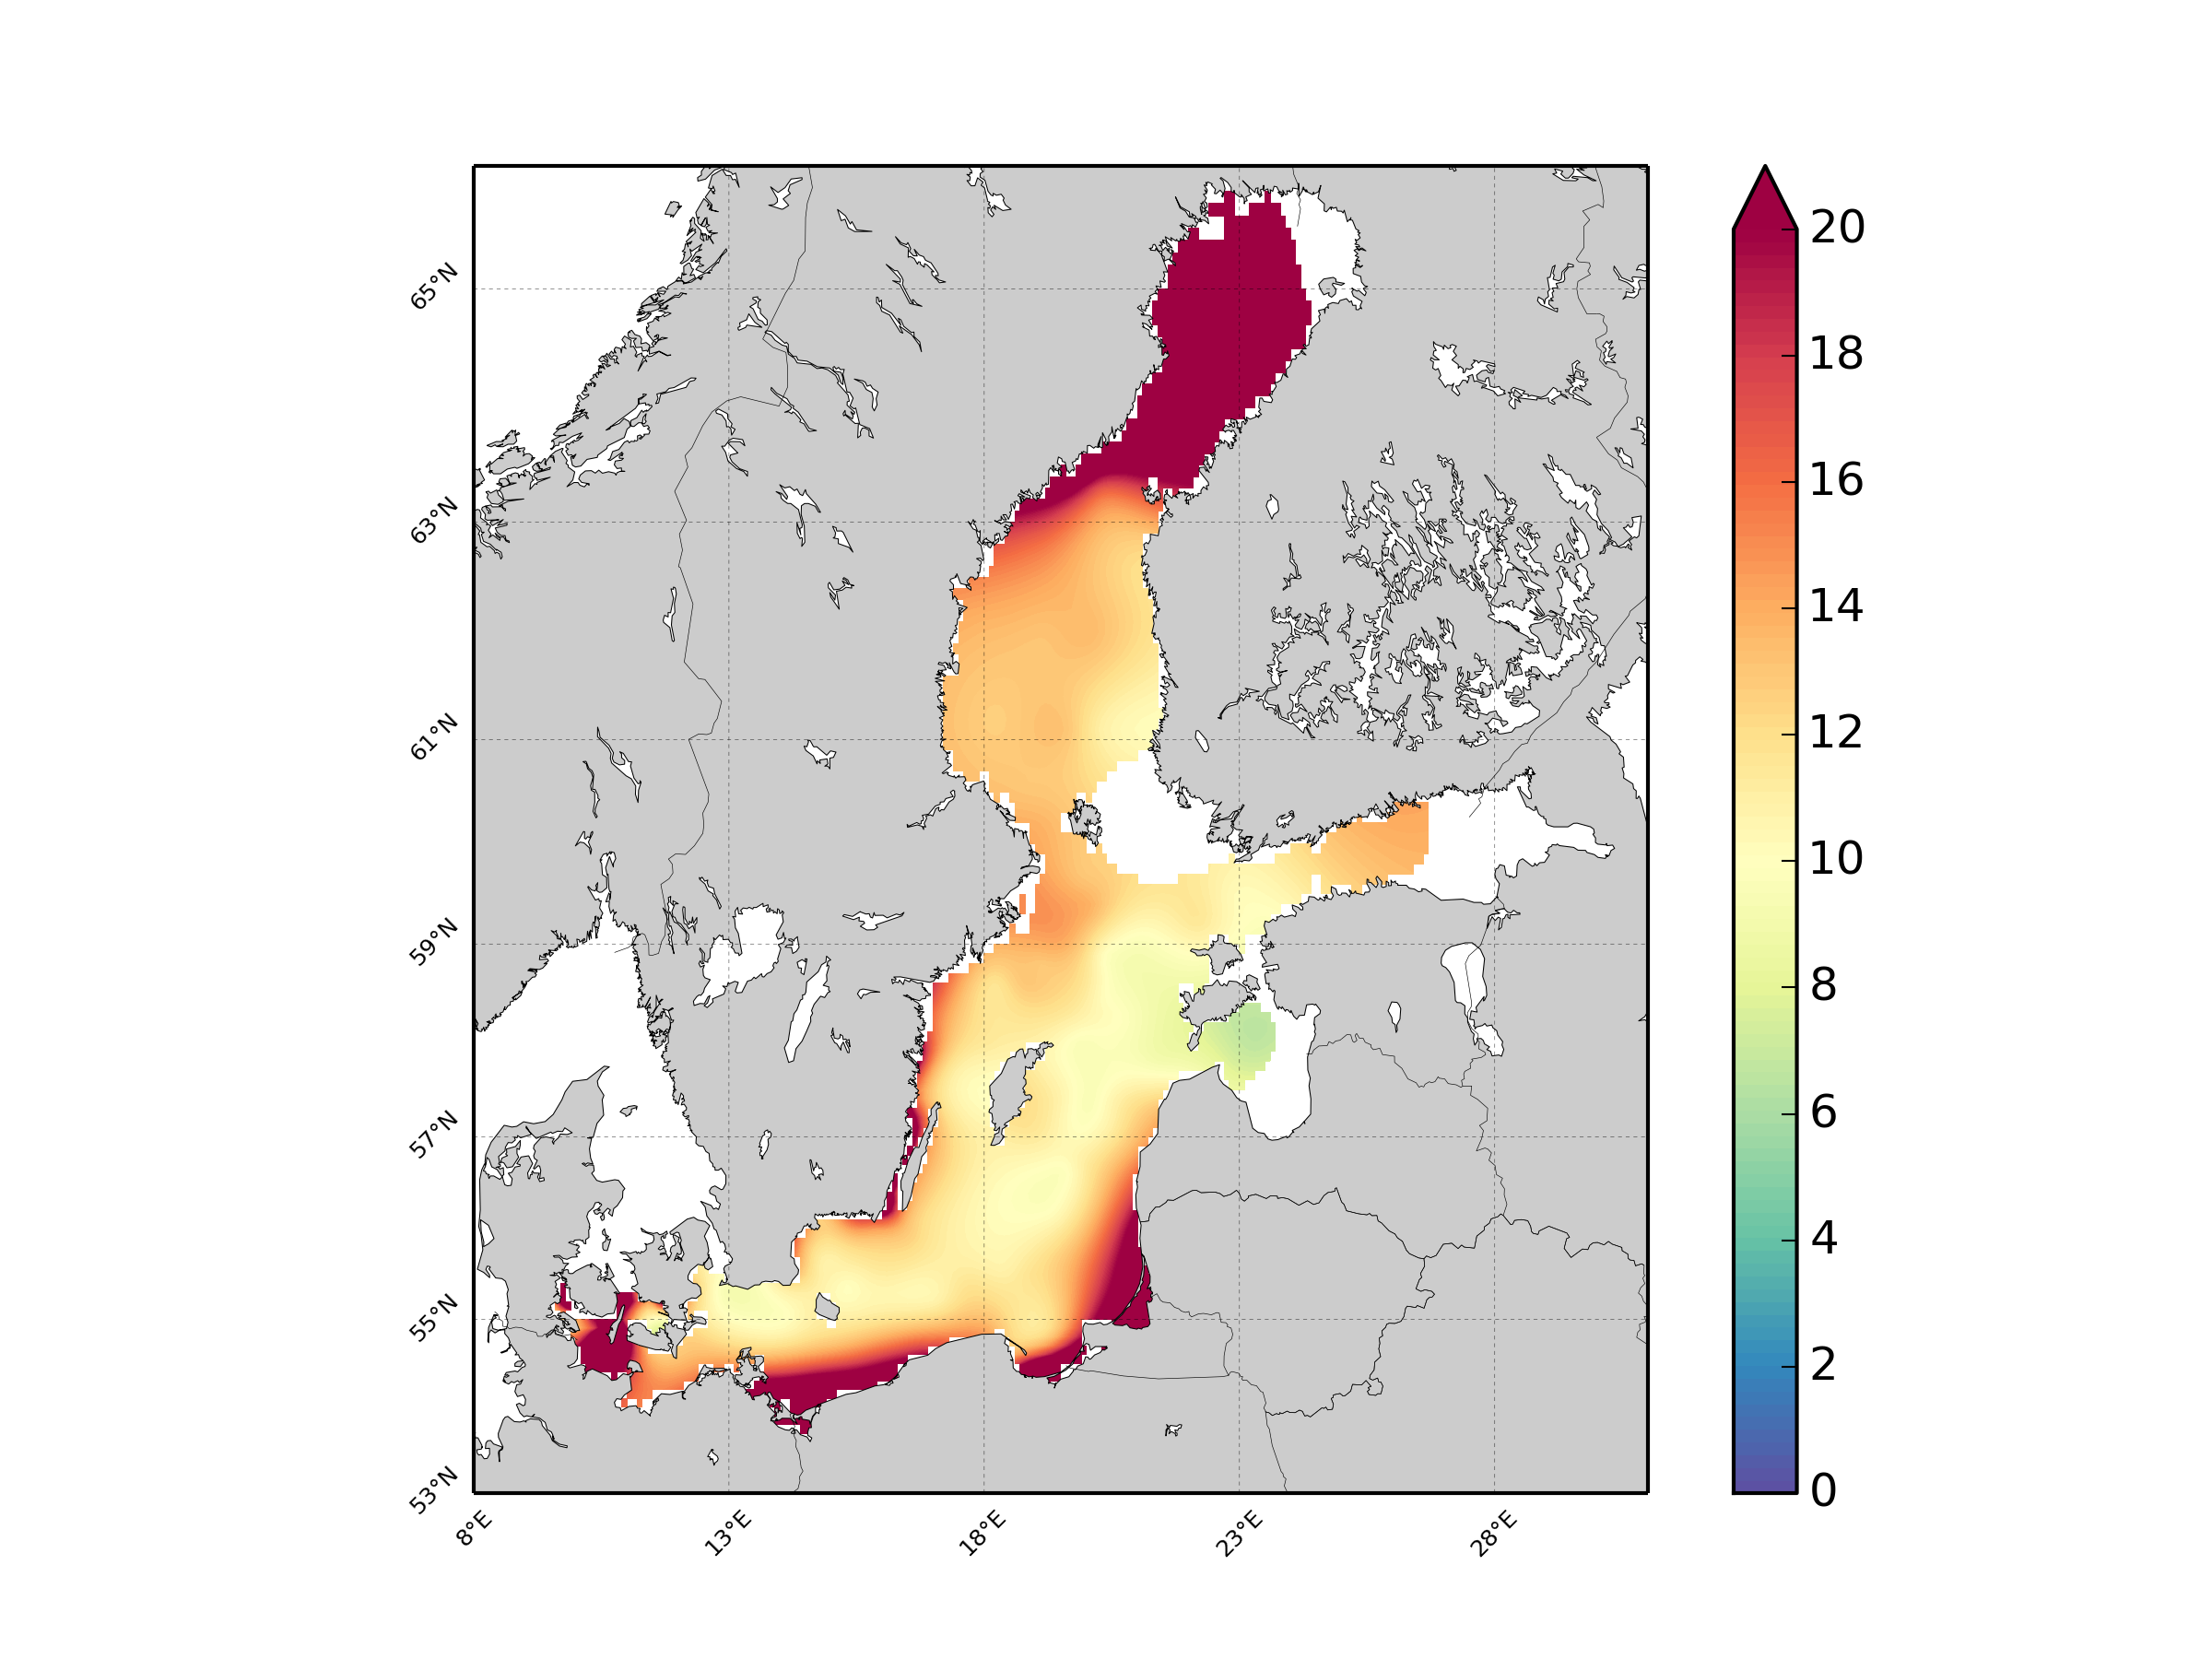
Units: umol/l. Method: spatial interpolation produced with DIVA (Data-Interpolating Variational Analysis). URL: http://modb.oce.ulg.ac.be/DIVA. Comment: Every year of the time dimension corresponds to a 10-year centred average for each season : - winter season (December-February), - spring (March-May), - summer (June-August), - autumn (September-November). Diva settings: Snr=1.0, CL=0.7.
-
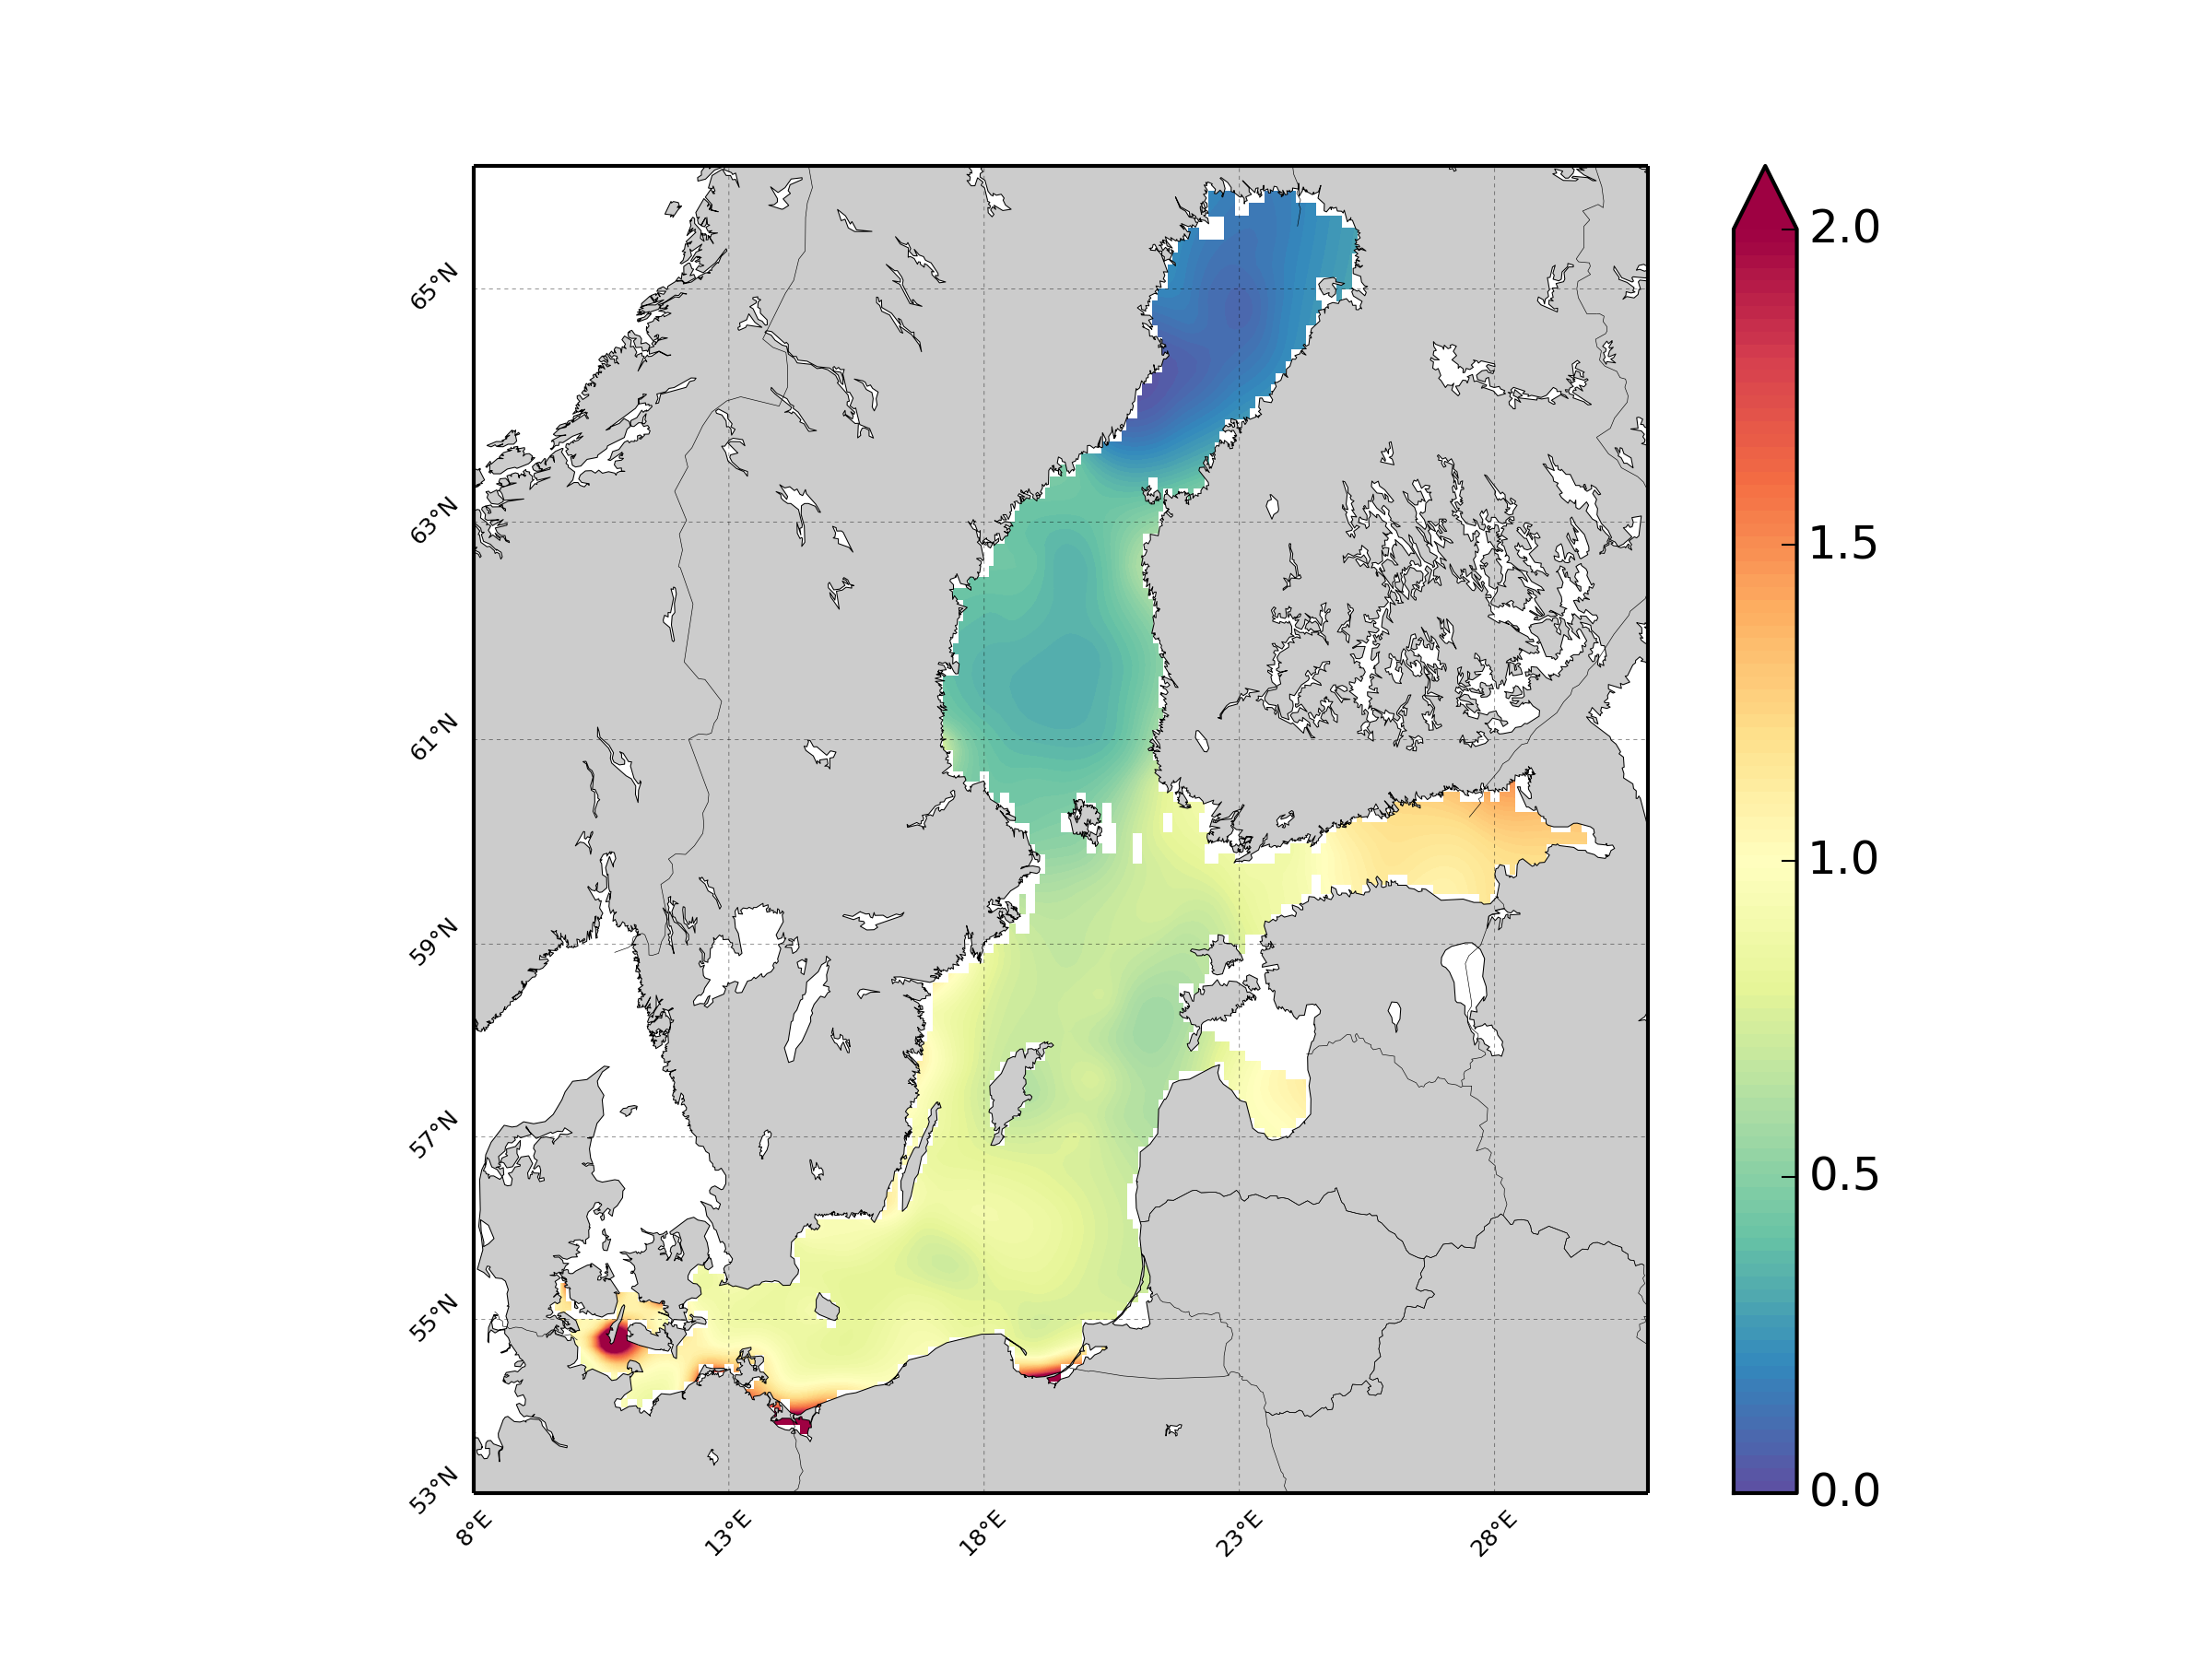
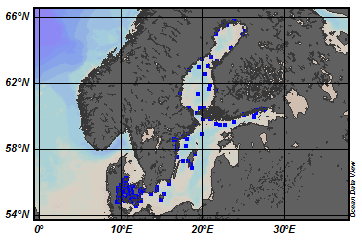
EMODnet Chemistry aims to provide access to marine chemistry data sets and derived data products concerning eutrophication, ocean acidification and contaminants. The chemicals chosen reflect importance to the Marine Strategy Framework Directive (MSFD). This regional aggregated dataset contains all unrestricted EMODnet Chemistry data on contaminants (49 parameters), and covers the Baltic Sea with 3818 CDI records divided per matrices: 1358 biota (396 Vertical profiles and 962 Time series),906 water profiles, 2510 sediment profiles. Vertical profiles temporal range is from 1985-04-16 to 2016-09-27. Time series temporal range is from 1972-05-02 to 2017-10-30. Data were aggregated and quality controlled by ‘Swedish Meteorological and Hydrological Institute (SMHI)’ from Sweden. Regional datasets concerning contaminants are automatically harvested. Parameter names in these datasets are based on P01, BODC Parameter Usage Vocabulary, which is available at: http://seadatanet.maris2.nl/bandit/browse_step.php . Each measurement value has a quality flag indicator. The resulting data collections for each Sea Basin are harmonised, and the collections are quality controlled by EMODnet Chemistry Regional Leaders using ODV Software and following a common methodology for all Sea Regions. Harmonisation means that: (1) unit conversion is carried out to express contaminant concentrations with a limited set of measurement units (according to EU directives 2013/39/UE; Comm. Dec. EU 2017/848) and (2) merging of variables described by different “local names” ,but corresponding exactly to the same concepts in BODC P01 vocabulary. The harmonised dataset can be downloaded as ODV spreadsheet (TXT file), which is composed of metadata header followed by tab separated values. This worksheet can be imported to ODV Software for visualisation (More information can be found at: https://www.seadatanet.org/Software/ODV ). The same dataset is offered also as XLSX file in a long/vertical format, in which each P01 measurement is a record line. Additionally, there are a series of columns that split P01 terms in subcomponents (measure, substance, CAS number, matrix...).This transposed format is more adapted to worksheet applications users (e.g. LibreOffice Calc). The 49 parameter names in this metadata record are based on P02, SeaDataNet Parameter Discovery Vocabulary, which is available at: http://seadatanet.maris2.nl/v_bodc_vocab_v2/vocab_relations.asp?lib=P02 . Detailed documentation will be published soon. The original datasets can be searched and downloaded from EMODnet Chemistry Download Service: https://emodnet-chemistry.maris.nl/search
-
NorFish is a European Research Council (ERC) Advanced Grant led by Prof Poul Holm in Trinity College Dublin, focuses on the premise that a 16th century shift in marine fish pricing and supply in conjunction with the Little Ice Age and lowering of sea temperatures not only rise to the North Atlantic Fish Revolution but also forms one of the first documented examples of the disrupting effects of globalisation and climate change. The project examines the role of the Fish Revolution for a range of inter-related aspects of North Atlantic history, with NorFish’s interdisciplinary team drawing on archaeology, history, cartography, geography, and ecology to develop interpretative frameworks that synthesise a broad spectrum of source data to assess the overall objective of the project. NorFish’s interdisciplinary team draws on archaeology, history, cartography, geography, and ecology to assess the objectives of the project.
-
The dataset provides full-coverage maps of the habitats and biotopes in the German Baltic Sea at a resolution of 1 x 1 km for the entire region and at 50 x 50 m resolution in specific areas. We combined geological and biological surveys to map the seabed and collected extensive data to classify different habitats and their associated benthic communities. Using newly established national guidelines and predictive habitat modelling, we produced highly accurate maps. The maps show Broad and Other Habitat Types (including Habitats Directive Annex I habitat types) according to the Marine Strategy Framework Directive (MSFD) as well as HELCOM HUB biotope types. Detailed documentation is available at: https://doi.org/10.3390/biology13010006